Introduction
Inkscape generates SVG files which are simply XML files with a predefined schema. This makes it very easy to generate graphic files which can then be viewed in Inkscape fully utilizing zoom functionality and all.Purpose
I wanted to generate an Inkscape file from the list of coordinates I get for rectangles I generate to discretize a conductive pattern that I would like to feed into Fast Henry to calculate the inductance. To make sure my discretization generation routines work good the best way would be to draw them out and look at them. For that Inkscape file generation seems to be the easiest and quickest way.Methodology
Just save a file from Inkscape after drawing 1 rectangle with the desired properties. Now all you have to do is copy and replicate that rectangle definition tag by just changing the id, height, width, x, y and transform (if required) attributes to generate a SVG file with many rectangles of the discretized pattern and then simply open the file in Inkscape and look at it.Coordinate system
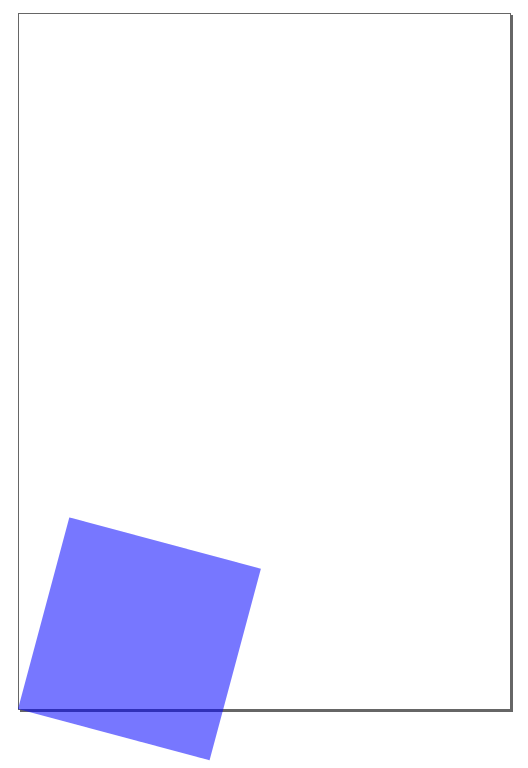
The coordinate system of Inkscape needed some investigation. I drew a rectangle and modified its attributes manually in the SVG file to generate the following drawing:
The page is seen in a blank document in Inkscape and the coordinates of any object seen in Inkscape window are relative to the page. Here is how the coordinates work:
- In the SVG file 0,0 coordinate means the top left corner of the page with x values increasing towards the right and y values increasing downwards (standard SVG definition)
- For a rectangle the x,y attributes specify the top left corner of the rectangle. So setting x,y=0,0 will put the top left corner of the rectangle on the top left corner of the Inkscape page.
- The Inkscape window takes 0,0 as the bottom left corner of the page with x values increasing towards the right and y values increasing upwards
- Inkscape reads the SVG file draws the shapes according to the SVG standard definition and then recalculates the coordinates of the drawn shapes according to the Inkscape window coordinate system and then displays them.
With these rules in mind the above object SVG definition is:
Line 2 shows the style having the transparency and no boundary properties. So the rectangle is a square with side 300. The x=0 so the square left side will be placed with the left side of the page. The y=752.362. The page height in my case was 1052.362 so having y = page height - 300 aligns the lower left corner of the square with the lower left corner of the page. Then the transform is applied to rotate the square by 15 degrees. The rotation is done with the point 0,1052.362 as the axis. 15 degrees positive rotation means clockwise because of the reversed y axis of SVG. After the rotation the lower left corner of the square will still align with the lower left corner of the page since it was the axis of rotation.
This is what is seen in the image.