Overview
Here is a guide to running Monte Carlo Analysis on CadencePrerequisites
- You have models with mismatch data for the technology and fab you are using.
Steps
Step 1 - Get basic simulation running
- First have your circuit running the simulation in a normal ADE setup and to have your measurements done and setup in ADE. These measurements can then be used in the Monte Carlo Analysis to find standard deviations
- Save the state from ADE on to the cellview and give it a name
Step 2 - Start and setup ADE-XL
- Since Cadence 6 monte carlo analysis run through ADE-XL. The separate tool that used to exist prior to cadence 6 is no longer there so you need to use the ADE-XL license which I don't like.
- Once you open ADE-XL you get an interface like shown below:
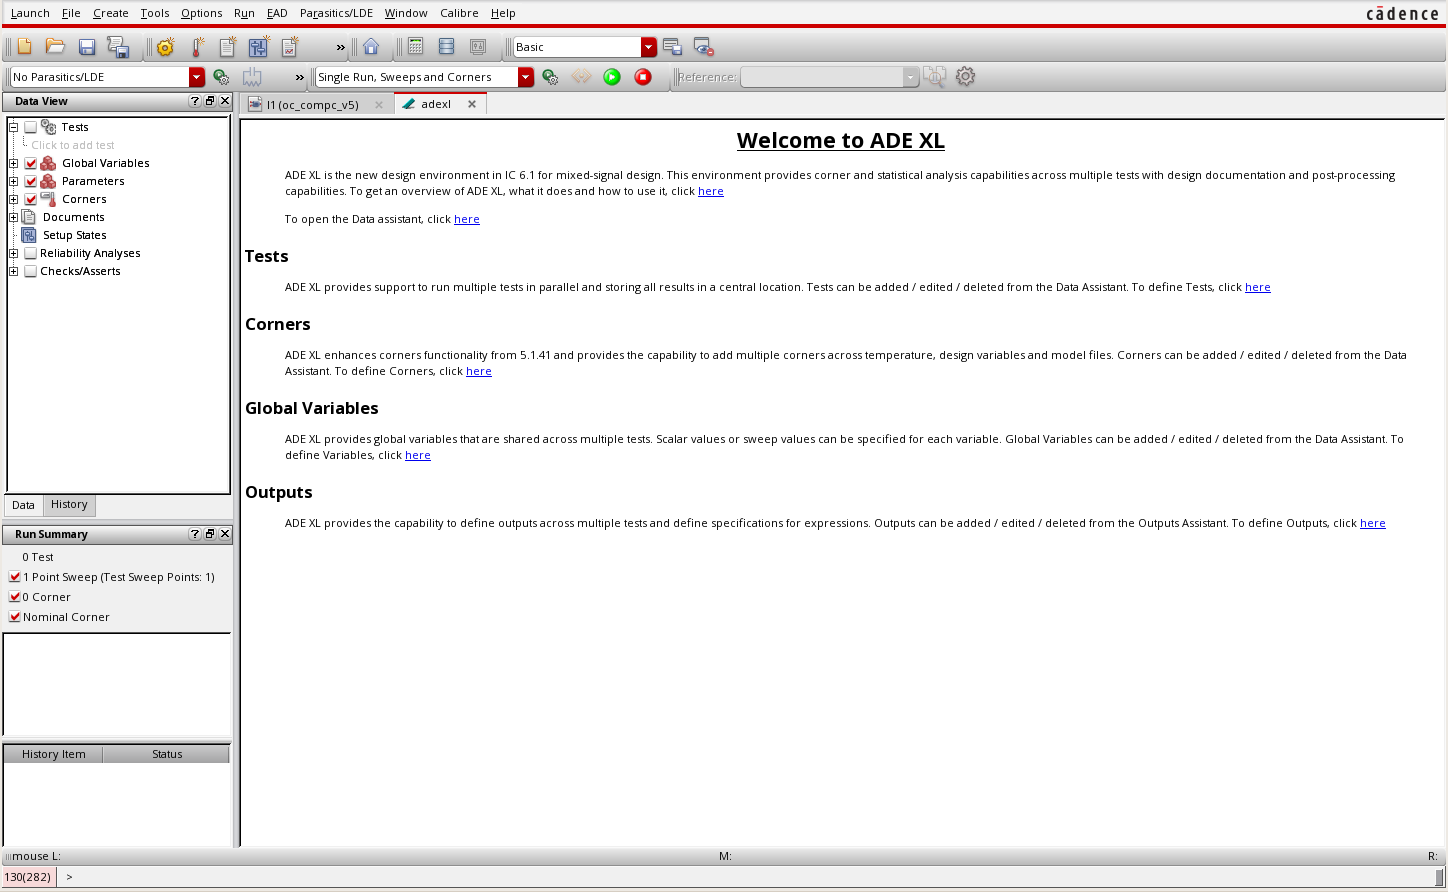
- On this in the Data View panel (which should be already visible as shown above, if not you can show it from Window->Assistants->Data View menu item
- Expand the Tests item in the Data tab of Data view panel and click to add a test.
- This opens a new ADE control panel and asks you to select a design.
- Choose the test bench schematic as the design
- Load the saved state into this ADE control panel.
- Change your model file to point to the model file or section which has the mismatch models by going into Setup->Model Libraries
- Run the simulation to make sure everything is working as expected with the mismatch models in place. With one simulation the results should be the same as with the typical simulation.
- Close the ADE window now.
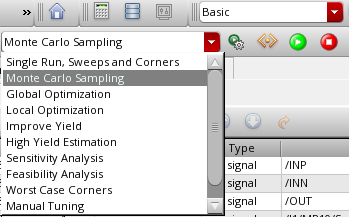
- Now in the drop down menu in the tool bar select Monte Carlo Sampling as shown below
- Click the gear button next to the drop down to setup the settings. The form for the Monte Carlo settings looks as shown below
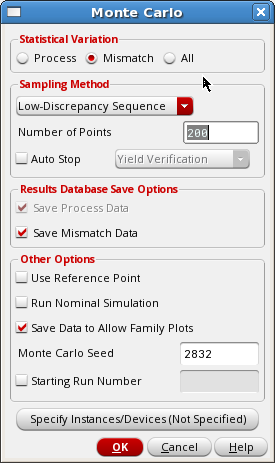
- Fill out the form.
- Select Save Mismatch data if you want to see the contributions of various devices.
- Set the number of runs. 200 is a good number to use during design. 1000 is good for collecting data to put in design reviews once the circuit is finalized.
- If you are plotting waveforms then check Save Data to Allow Family Plots. So you can see the waveforms for all the runs plotted together.
Step 3 - Run the simulation
This is done by clicking the green toolbar button besides the drop down simulation selection box from where we selected Monte Carlo SamplingLooking at Results
Once the simulation finishes your screen would look something like: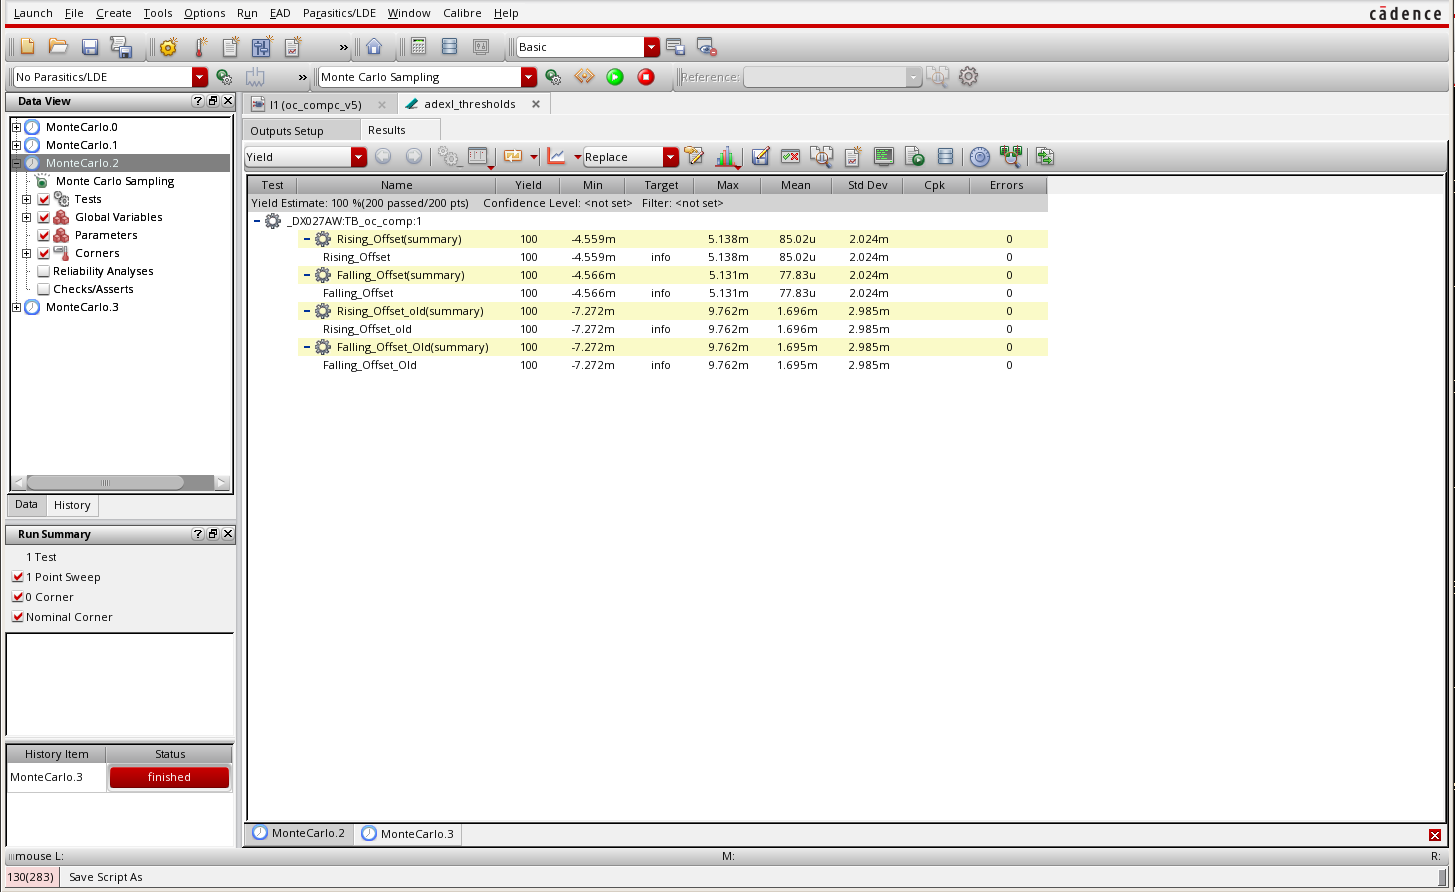
Mismatch contribution
- Select the History tab in the Data View panel.
- Right click the MonteCarlo run to bring the following menu:
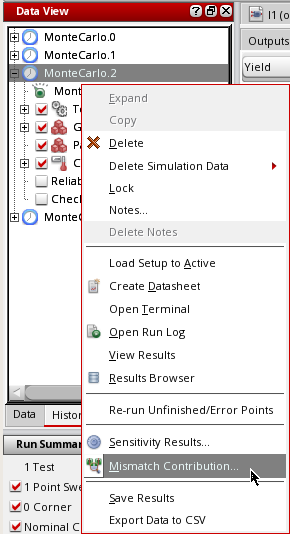
- Select the Mismatch Contribution... option to bring out the mismatch contributions of the various components:
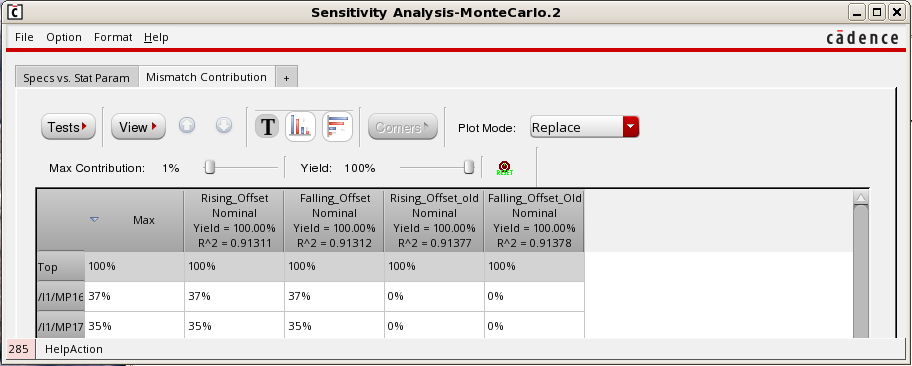
- The mismatch contributions of each device is listed in this table
Parameter distribution histogram
- Click the histogram selection button from the toolbar as shown below:

- That brings the following form to select the outputs you want to plot the histogram for.
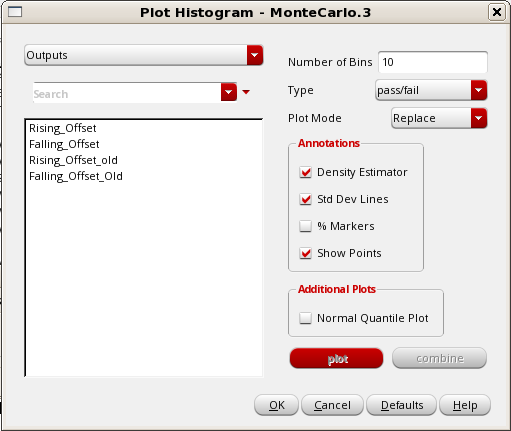
- Select the outputs you want to plot the histogram for (multiple outputs can be plotted together) and click plot to display the histograms.